Home
> Research
> High Pressure Phase Equillibria
> Methanol-Water
Preliminary Studies of Methanol-Water Solutions
Background
Sub-surface oceans have been proposed to exist on many of the large
icy moons of the outer solar system. The thickness of a shell and
the depth of any such ocean depend on many factors, including the
composition and pressure-dependent freezing points of the materials
likely to be found in the ocean.
On Enceladus, the observations of water-rich plumes and the measured
libration are consistent with a global subsurface ocean under a
rather thin ice shell, perhaps less than 10 km thick.
Any subsurface ocean would likely contain impurities, such as ammonia
and methanol, that act as powerful antifreeze compounds. Small
amounts of methanol may have been detected on the surface of Enceladus
as well as in the plume. In addition to being a powerful antifreeze,
methanol could also play a role in the formation of methane hydrates
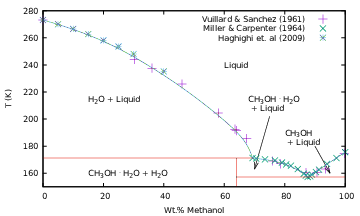
Methanol-Water Phase Diagram
Experiments
Although the effects of pressure on pure ice and pure methanol have
been extensively studied, the behavior of water-methanol mixtures
under pressure has not been studied as extensively. In this work,
we consider the freezing behavior of methanol-water solutions at
low temperatures and moderate pressures such as might be encountered
in the icy moons of the outer solar system.
Specifically, we report measurements of the
liquidus points for
at pressures ranging from 5 to 400 MPa, using simultaneous measurements
of pressure, volume, and temperature, coupled with optical images
of the sample.
The phase boundaries for pure water {wagner2011,dunaeva2010} and
pure methanol {wurflinger1977} are included for comparison. For
water-rich solutions, the liquidus trends follow that of pure water,
while the eutectic points, and liquidus points for methanol-rich
solutions, follow that of pure methanol.
References
[1] M. Dougherty, et al. (2006) Science 311 (5766):1406.
[2] C. Porco, et al. (2006) Science 311 (5766):1393.
[3] J. H. Waite, Jr., et al. (2009) Nature 460 (7259):1164.
[4] C. J. Hansen, et al. (2011) Geophys Res Lett 38:L11202.
[5] H.-W. Hsu, et al. (2015) Nature 519 (7542):207. [6] F.
Postberg, et al. (2011) Nature 474 (7353):620.
[7] P. C. Thomas, et al. (2016) Icarus 264:37.
[8] D. Hogenboom, et al. (1997) Icarus 128 (1):171.
[9] R. Hodyss, et al. (2009) Geophys Res Lett 36:L17103.
[10] G. McLaurin, et al. (2014) Angewandte Chemie-International Edition 53 (39):10429.
[11] J. S. Kargel (1992) Icarus 100:556.
[12] G. Vuillard, et al. (1961) Bull Soc Chim France 1877–1880.
[13] G. A. Miller, et al. (1964) J Chem & Eng Data 9 (3):371.
[14] W. Wagner, et al. (2011) J Phys and Chem Ref Data 40 (4).
[15] A. N. Dunaeva, et al. (2010) J Solar System Research 44 (3):202.
[16] A. Wurflinger, et al. (1977) J Phys Chem Solids 38:811.

This page is occasionally maintained by
Andrew Dougherty