Home
> Research
> High Pressure Phase Equillibria
High Pressure Phase Equilibria
Several of the icy moons of the outer solar system probably have
subsurface oceans. Particularly interesting examples are Europa (a
moon of Jupiter), and Enceladus and Titan (moons of Saturn).
Thermodynamic models of the interiors of icy moons can benefit from
an improved understanding of how the presence of various impurities
will change the temperature and pressure-dependent properties of
water and ice in any such subsurface ocean.
This project focuses on phase equilibria in aqueous solutions at
pressures ranging from from 0.1 to 400 MPa.
Most recent paper
"The Liquidus Temperature for Methanol-Water Mixtures at High Pressure and Low
Temperature, With Application to Titan"
Journal of Geophysical Research--Planets,
with Lafayette co-authors Z.T. Bartholet, R.J. Chumsky, K.C. Delano, X. Huang, and
D.K. Morris.
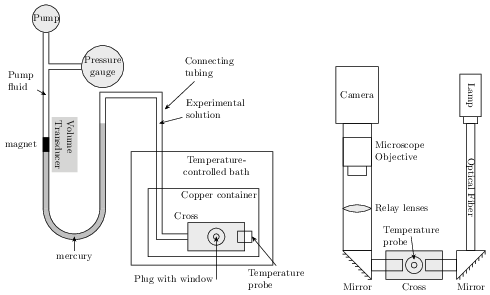
The apparatus consists of 3 main parts: a central high-pressure
fitting containing the sample fluid, an optical system for imaging
the sample, and a pressure system that includes both pressure and
volume sensors
Approximately 1 mL of sample is loaded into a pressure cell that
is placed in a copper container and immersed in an insulated,
temperature-controlled ethanol/water bath. The pressure cell is
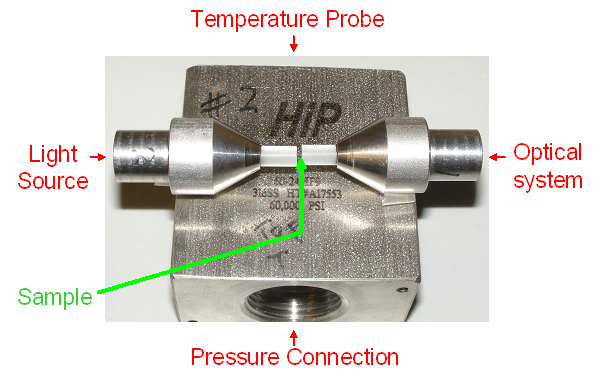
made from a 316 stainless steel block with four ports, known as a
cross (High Pressure Equipment Company #60-HF6). Two opposing ports
contain replaceable plugs that have sapphire windows sealed in them
with epoxy. The third port contains a plug in which a silicon diode
thermometer is installed. The fourth port connects the cell to the
pressure system. The sample in the pressure cell is separated from
the ethylene glycol pump fluid by a vertical U-tube filled with
mercury. A steel capillary tube of constant cross section forms one
arm of the U-tube. A small Alnico magnet is placed in the capillary
on the interface between the pump fluid and the mercury, and the
height of that magnet is measured by a transducer. Changes in the
transducer voltage are approximately proportional to changes in
sample volume. As long as the sample is mostly liquid, this system
allows simultaneous measurements of temperature, pressure, and
volume of the sample. When the sample in the connecting tubing is
frozen, however, the pressure inside the cross can be significantly
different.
The imaging system consists of a lamp that shines light through an
infrared filter and optical fiber that directs the beam horizontally
through the sample cell. The infrared filter is used to minimize
heating of the sample by the light source. After passing through
the cell, the beam is reflected by 45o mirror upward through a
matched pair of lenses to a long working distance optical microscope
objective coupled to a Pulnix digital camera. The camera obtains
images of a vertical cross-section of the sample, with 1392 \times
1040 pixels and an overall resolution of about 1.7 μm/pixel.
The gap between the sapphire windows is approximately 1~mm. Although
the camera's field of view does not cover the entire system, we
typically observed dissolving or growing crystals corresponding to
changes in temperature, pressure, and volume, indicating that the
crystal images reflect the phase transitions within the sample. We
have studied a variety of solutions likely to be relevant for the
icy moons of the outer solar system, including aqueous mixtures of
magnesium sulfate, sodium sulfate, methanol, and water.
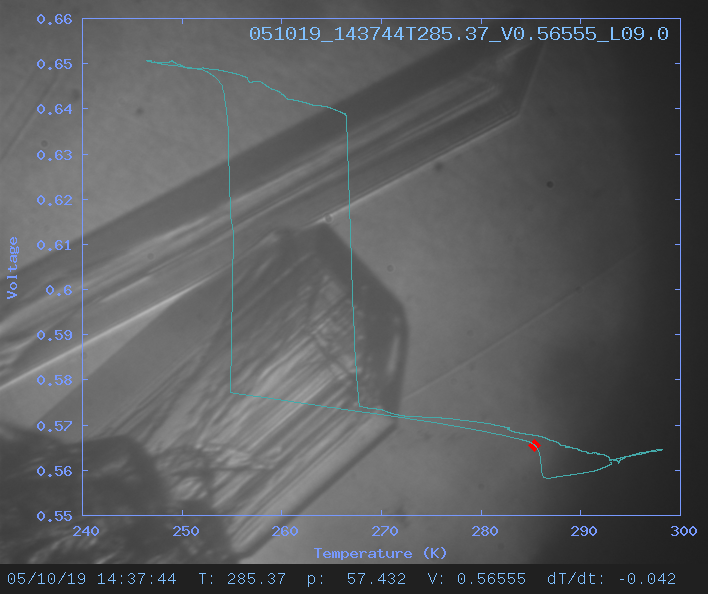
For each run, we make a movie showing the view through the windows
of the growth chamber. Superimposed on the view is a graph showing
Voltage (approximately proportional to Volume) vs. Temperature.
Thus we can correlate changes in volume (and hence density) with
the growth or dissolution of different crystal phases.
Staring in 2001, I joined Prof. Emeritus David
Hogenboom, along with his long-time collaborator Jeff Kargel,
of the University of Arizona, in their studies of phase equilibria at
the high pressures and low temperatures relevant for icy satellites.
My main initial contributions were adding image processing and much more
extensive automation.
I have also been fortunate to work with a wonderful array of talented
Lafayette undergraduate students on this project, including:
- Zachary Bartholet
- Ross Chumsky
- Kevin Delano
- Bill Huang
- Dustin Morris
- Jaclyn Avidon
This page is occasionally maintained by
Andrew Dougherty